Debugging the code that you haven’t written is a art! We always look for some help from the application developer that would perhaps tell you what’s going on in the application when you perform certain actions. With the rich client applications becoming the main stream, it’s very important that the libraries, and client side frameworks provide with additional debug statements emitted to the browser, so that anyone who are trying to debug the application, gets a little help.
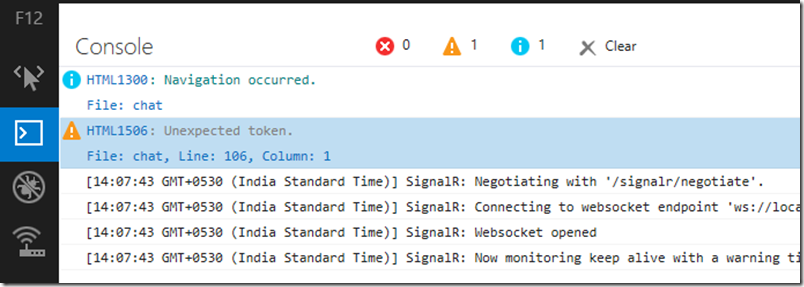
ASP.NET SingalR is one popular library for the ASP.NET developers to build rich, real-time web applications. SignalR’s client side library emits useful debug statements in each event that’s occurring, and that’s very helpful if you are trying to debug your application. For example, if you have the logging enabled for your hub, you would see the below events during the connection establishment. I’m using the sample application that’s build in this tutorial for this blog.

Yeah, that’s the awesome looking F12 Developer tools on IE11 Preview. Try it out, and read more about it’s new features here. I’ll perhaps talk about that in a different post later. Let’s come back to our issue at hand. If the developer of this application is you, or someone who is kind enough to turn on logging, they would do this. Most of the time when you are trying to debug other’s production application (like me for living), or some out of curiosity, you will try to find options to ease your job. Here in this case, if I can turn on the logging for the hub, I’m golden. Let’s see how to do this.
Logging for the SignalR hub, if you are using the automatic proxy generated, can be enabled by the below code:
$.connection.hub.logging = true;
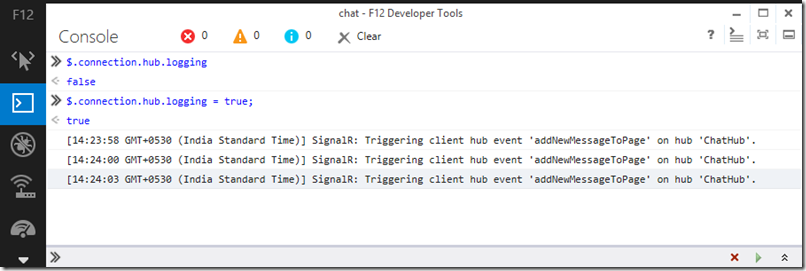
Again, in our case, we do not have the access to the code. Somehow, you need to enable the logging in the browser for the application instance loaded inside. Yeah, you guessed it right – console. Most Browsers include Developer Tools that include ‘Console’. That’s most of the time used to emit debug information to understand what’s going on, and most of the time, the developers turn the debug statements on/off via switch, same as ASP.NET SignalR client side library. Do the below steps to enable the logging like above, even if the code doesn’t have it enabled:
- Browse to your ASP.NET SignalR application.
- Open F12 Developer Tools, and go to the ‘Console’
- Type the same code as above to enable the logging - $.connection.hub.logging = true; in the console window, and hit return.
- You would now start seeing all the debug messages that SignalR framework emits.

However, in this case, we enabled the logging after the connection was established, and so on. However, most of the time we would debug issues on the connectivity itself. In those times, start debugging your page with IE11 F12 Developer tools, if you have noticed, in the latest version, you do not need to reload the page! Set a breakpoint in the $.connection.hub.start() method (inside jquery.signalR-1.1.3.js), and refresh the page. Once the page is refreshed, you could execute the same code in the console as above, so that the option to logging is set. Debug statements that the client side library emits is pretty verbose. For example, when I turned off WebSockets in my IE11, I see the below during the connection establishment, and you would see it switching to long polling mode.

Hope this helps someone who want to understand what’s going on in someone else’s ASP.NET SignalR at the client side.